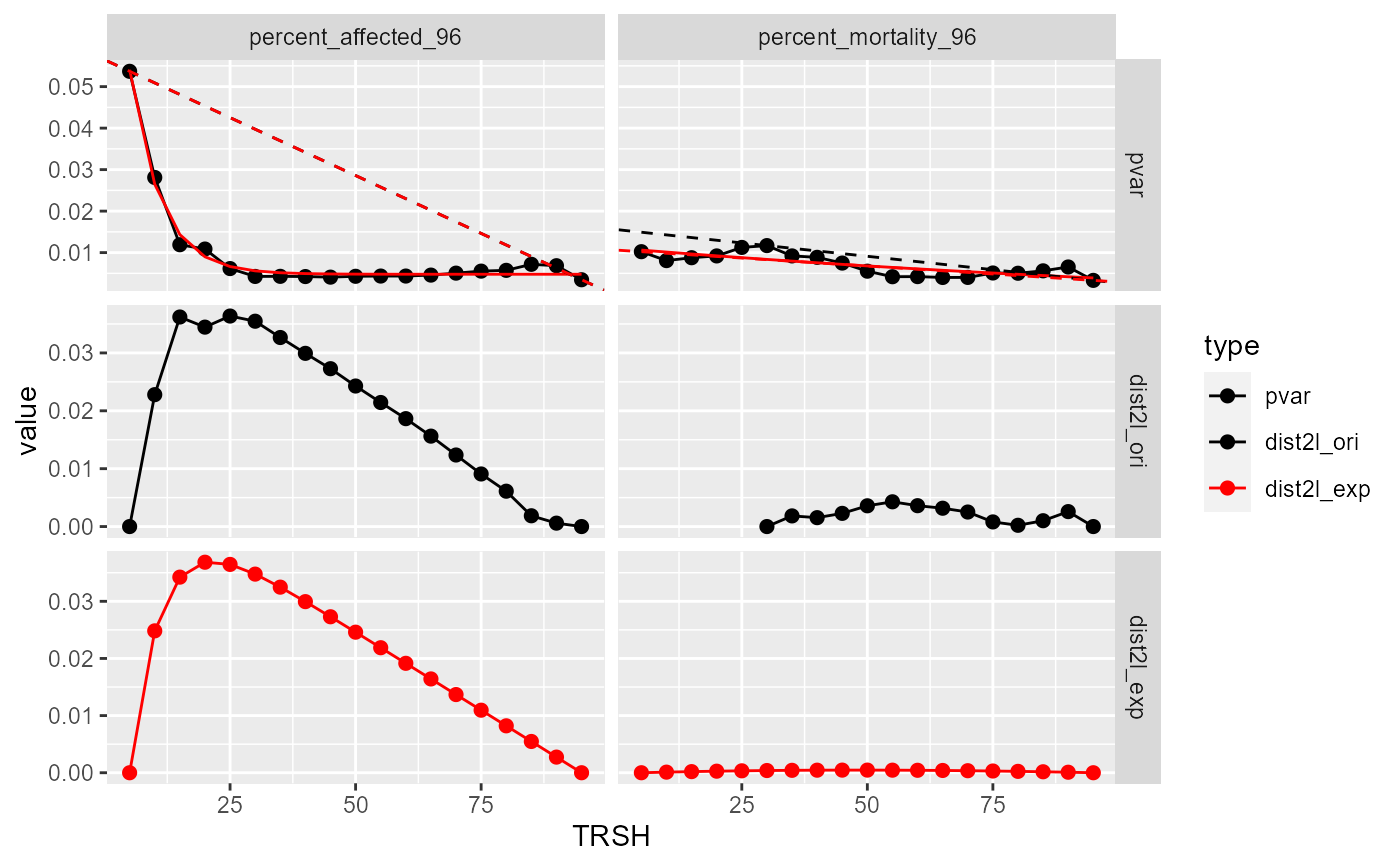
Plot BMR diagnostic curves
Usage
# S3 method for class 'rcurvep_bmr'
plot(x, ...)
Arguments
- x
The rcurvep_bmr object from
estimate_dataset_bmr().- ...
Allowed values: n_in_page, number of endpoints in a page.
Examples
data(zfishdev_act)
bmr_out <- estimate_dataset_bmr(zfishdev_act, plot = FALSE)
plot(bmr_out)
#> $`1`
#> Warning: Removed 5 rows containing missing values or values outside the scale range
#> (`geom_point()`).
#> Warning: Removed 76 rows containing missing values or values outside the scale range
#> (`geom_line()`).

#>
#>